


By Joseph D’Aleo, CCM
Deaths from heat waves, property damage from floods and rising seas from melting glaciers are a few of the things Americans can expect as a result of climate change, the U.S. Environmental Protection Agency said in a report released on Tuesday, April 28, 2010.
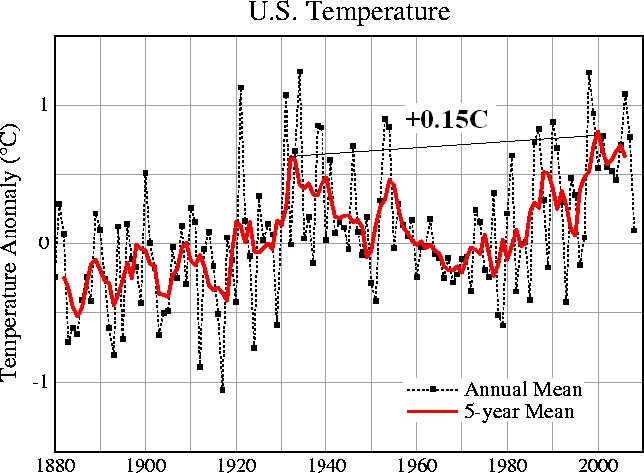
“...heat waves have increased steadily since the end of the 1970s. “For society, increases in temperature are likely to increase heat-related illnesses and deaths, especially in urban areas,” said the report, which relied on data from a variety of U.S. and international agencies and sources.
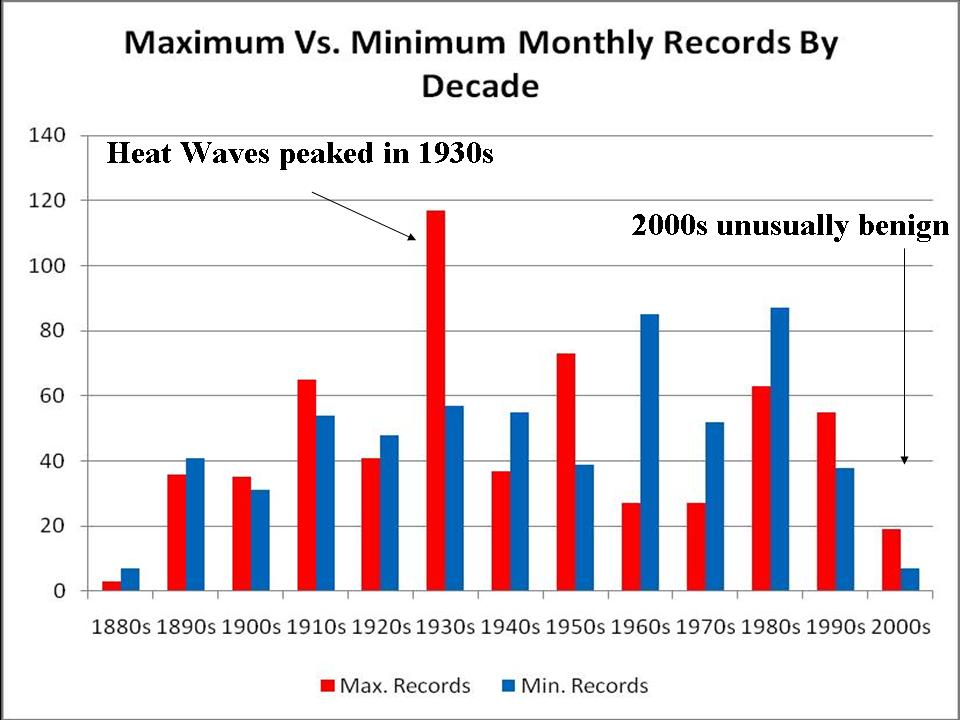
One of these sources was the NCAR study by Meehl et al which we covered last year with the help of analysis by Bruce Hall and Dr. Richard Keen here and here.
In it we showed that had they started the analysis before the 1950s, they would have seen the dominance of heat in the 1930s (below, enlarged here).
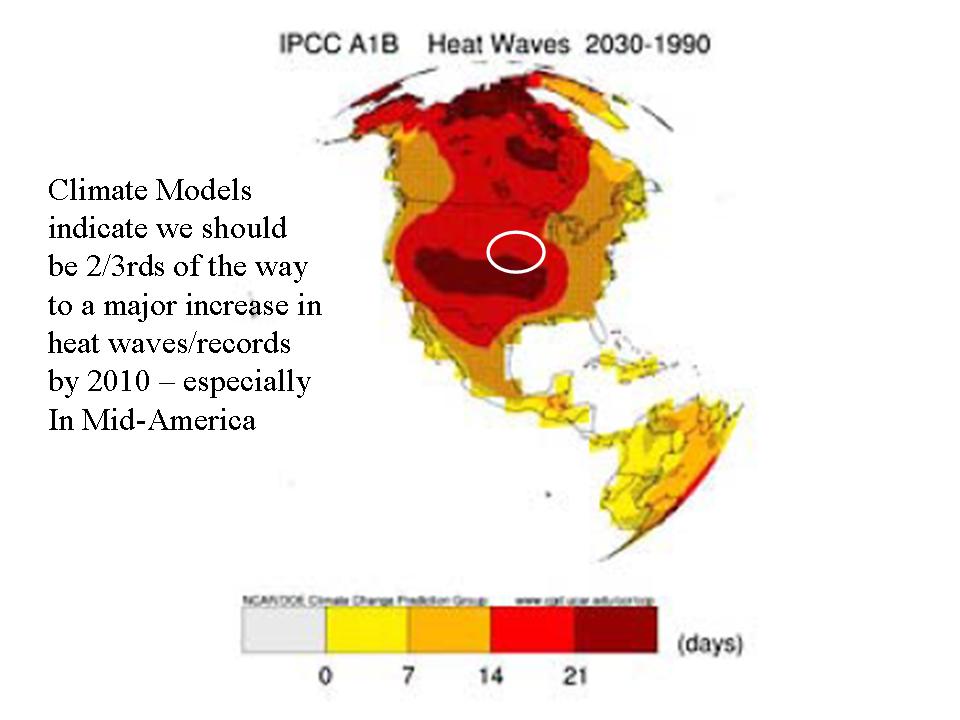
The IPCC models for the increase in heat from 1990 to 2030 (now the midpoint) show the heat should be concentrated in the central (continental) climates (below, enlarged here).

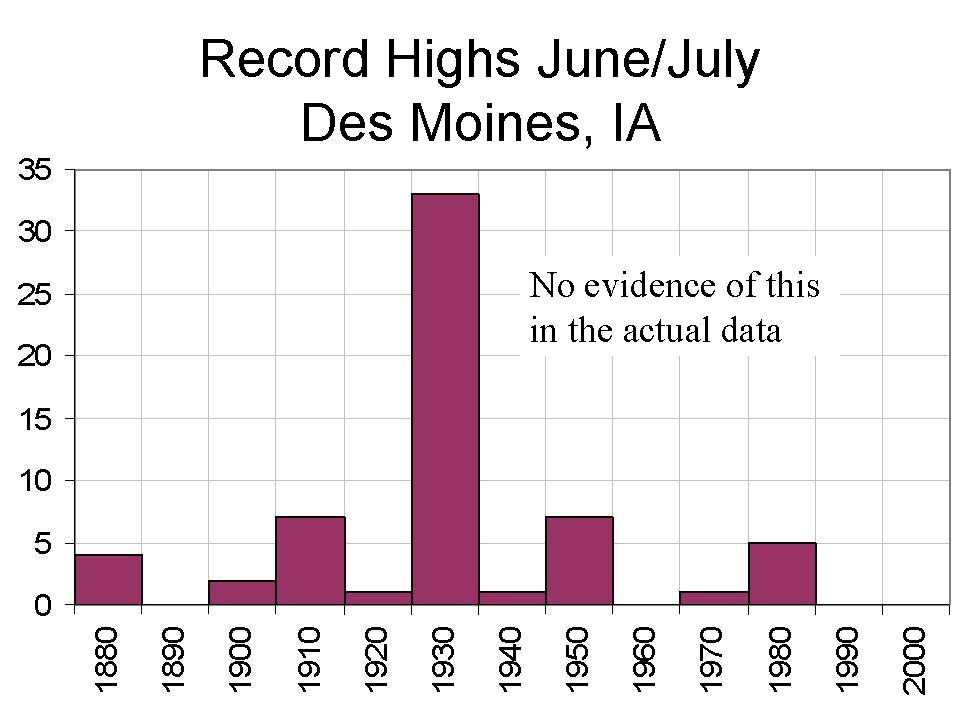
You can’t get any more central/continental than Des Moines, Iowa. How are they doing for heat records. Let’s look at heat records in June and July in Des Moines by decade (below, enlarged here). No signs of any increasing heat records here. Last record in 1988.

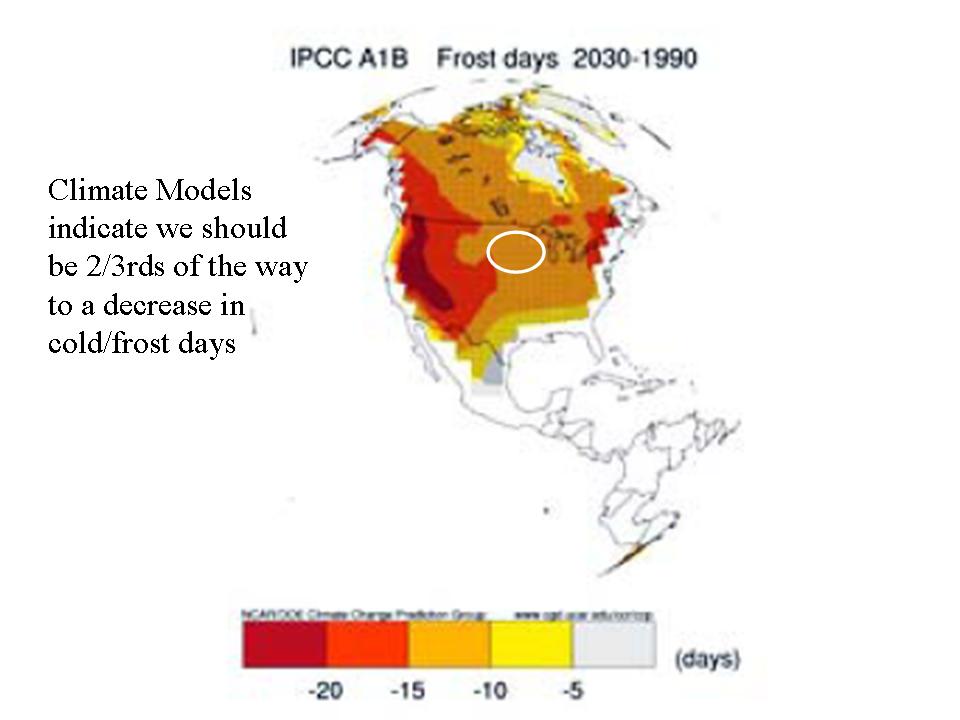
The IPCC models also see less cold - fewer frost days and milder winters (below, enlarged here).

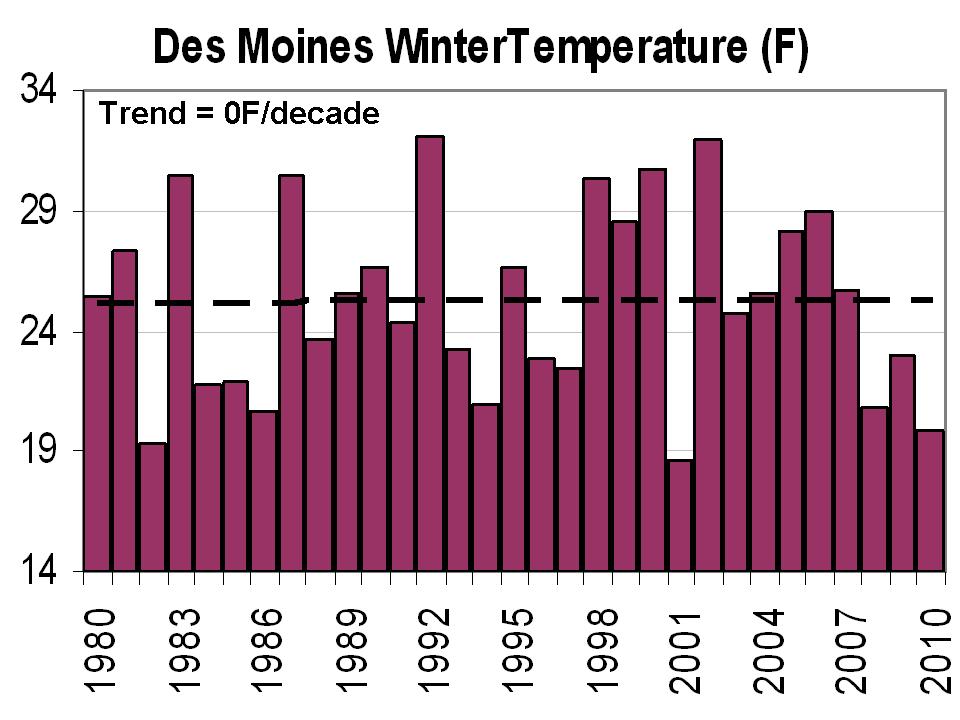
Here is a plot of Des Moines mean winter temperatures since 1980 (below, enlarged here). Notice no trend.

Notice the last three winters were cold (average of 2.83F below the 1951-2009 mean). They were very snowy winters too with this past winters 69” falling just short of the record of 72 inches in 1911/12.
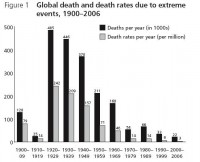
Note that given the El Nino giving way to La Nina, there could well be some developing heat this summer despite the fact most climate models and the soil moisture models say not for the central. Even so, if we have La Nina next winter, look for another cold winter in the north central states. Record show cold kills many more people than heat and deaths from all extremes have been declining.
More hype and lies from your government and the hype-prone Weather Channel.
----------------
Very Late Snow and Cold southwest Eorope.
After a warm spell at the end of April, old man winter made a comeback in May. The State of Catalonia, Spain, experienced the coldest temperatures for a month of May since records exists.
Provincial capitals registered the following minima: 0C in Salamanca, 0.3C in Avila, 0.8C in Burgos and Segovia, 1.8C in Soria, 2C in Guadalajara and Valladolid, 3C in Cuenca, 3,3C in Teruel, and 3.7C in Albacete. This was accompanied by snow in many parts of Northern Spain.
In Southern France: Snow on the city of Carcassone and in South-Western France - “a rare phenomenon this time of year”. 1C was registered at the airport of Tarbes-Lourdes, a record low for a 4th of May since measurements started in 1946. Across South Western France, temperatures dropped 20C within a couple of days (here)
---------------------
Fourth International Conference on Climate Change on May 16-18, 2010, Chicago, Illinois.
Make plans now to attend ICCC-4, an international conference on climate change calling attention to new scientific research on the causes and consequences of climate change, and to economic analysis of the cost and effectiveness of proposals to reduce greenhouse gas emissions.

by William Yeatman, Global Warming.org
On April 16th, the Cooler Heads Coalition and the Heritage Foundation hosted a briefing on Climategate by Dr. Patrick J. Michaels, Senior Fellow in Environmental Studies, Cato Institute and Joseph DAleo, Executive Director, ICECAP, and Consulting Meteorologist.
Dr. Patrick J. Michaels, Senior Fellow, CATO Institute
The scientific case for catastrophic global warming was already showing signs of weakening when the Climategate scientific fraud scandal broke in November 2009. This release of thousands of computer files and emails between leading global warming scientists showed evidence of data manipulation, flouting of freedom of information laws, and attempts to suppress publication of research that disagreed with the alarmist “consensus.”
Climategate has raised many questions about the reliability of key temperature records as well as the objectivity of the researchers and institutions involved, but it is far from the only global warming-related controversy. It has been followed by revelations that some of the most attention-grabbing claims in the 2007 UN Intergovernmental Panel on Climate Change’s (IPCC) Fourth Assessment Report - the supposed gold standard of climate science - were simply made up. Before laws regulating energy use are enacted that could well cost trillions of dollars, it is crucial to understand the extent to which the alleged scientific consensus supporting global warming alarmism has been discredited by these scandals. Join us for a discussion featuring two scientists who have closely studied Climategate.
Click here to view video of the briefing. See my PPT pdf here.
See post and more here.
Listen to this hour interview on Mark Gillar’s blog talk radio where I was one of the weekly guests. Look at the powerhouse line-up of other interviewees here.
------------------
EPA Staffers Were Forced to Ignore Science, Investigation Finds
By Sheila Kaplan
Environmental Protection Agency staffers have been forced to ignore relevant science, have lacked key monitoring data on human health and environmental impacts, and have worked without crucial information needed to protect the public, according to the preliminary findings of a scientific advisory board.
The Committee on Science Integration for Decision Making is still working on its investigation, but has quietly posted draft summaries on the agency’s website of 73 interviews with 450 EPA employees—an unusual bottom-up examination that could bring sweeping changes to the 40-year-old federal agency. Some staffers traced the problems in the agency to the Bush administration, while others said the obstacles are longstanding and continue to this day.
EPA has an enormous mandate—protecting air, water, land and human health from environmental pollutants. While some staffers gave the agency high marks, the interviews overall portray an organization that has been hobbled by political pressure to avoid damaging industry; has lacked sufficient scientists in regional offices; has been slow to act against known hazards, and has had a tendency to let products with harmful pollutants enter the marketplace and the environment without first ensuring their safety.
As part of its mission, the committee—informally called the Science Advisory Board—interviewed scores of EPA staffers from around the country between October 2009 and February 2010. To encourage open discussion, managers were generally interviewed separately from the rest of the staff. Many of the panel’s interviews were conducted in groups. Although the committee listed the names of everyone in each group, in most cases they did not reveal who said what.
Some participants noted “the chilling effect of management decisions made with the expectation that science would be ‘ginned up’ to support decisions already made,” according to a committee summary. One high-level EPA official charged that “the science review is used to create long-term loops that keep us from getting the latest information implemented in the field.” Another staffer said decisions on how to regulate air pollutants were “influenced more by politics than by science.”
One scientist who was interviewed believes the agency has been too eager to endorse new technologies or new uses of chemicals. As an example, she cited the EPA’s support of tire crumb, shredded tires used to line playgrounds to keep kids from being injured if they fall. Tire crumb can contain arsenic, cadmium, and other metals and toxic substances. Although EPA in December said the material was safe, this scientist told investigators, “Tire crumb, for example, should have been evaluated more fully before EPA supported its use for children’s playgrounds and ball fields...The result is a costly effort “post hoc” to assess children’s exposures to tire crumb waste, a problem that could have been prevented.” Read much more here.
By Paul Driessen with Willie Soon
First American Ann Bancroft and Norwegian Liv Arnesen trekked off across the Arctic in the dead of the 2007 winter, “to raise awareness about global warming,” by showcasing the wide expanses of open water they were certain they would encounter. Instead, icy blasts drove temperatures inside their tent to -58 F, while outside the nighttime air windchills plunged to -103 F.
Open water is rare at those temperatures, the intrepid explorers discovered. Facing frostbite, amputated toes and even death, the two were airlifted out 18 miles into their 530-mile expedition.
Next winter it was British swimmer and ecologist Lewis Gordon Pugh, who planned to breast-stroke across open Arctic seas. Same story. Then fellow Brit Pen Hadow gave it a go, but it was another no-go.
This year Aussie Tom Smitheringale set off to demonstrate “the effect that global warming is having on the polar ice caps.” He was rescued and flown out, after coming “very close to the grave,” he confessed.
Hopefully, all these rescue helicopters were solar-powered. Even hardened climate disaster deniers wouldn’t want these brave (if misguided) adventurers to be relegated to choppers fueled by hated hydrocarbons. They may be guilty of believing their own alarmist press releases - and the likes of Al Gore, James Hansen, the IPCC and Michael Mann, father of broken hockey sticks and Mann-made global warming. But missing digits or ideological impurity is a high price to pay.
Nonetheless, it’s easy to envision them dreaming of stoking up the boiler from the wreck of the “Alice May” over yonder on Lake Lebarge and chattering in their sleep: “Since I left Plumtree down in Tennessee, it’s the first time I’ve been warm.”
The explorers tried to put the best spin on their failures. “One of the things we see with global warming is unpredictability,” Bancroft-Arnesen expedition coordinator Anne Atwood said helpfully. “But please know global warming is real, and with it can come extreme unpredictable changes in temperature,” added Arnesen.
“Global warming can mean colder. It can mean wetter. It can mean drier. That’s what we’re talking about,” Greenpeace activist Stephen Guilbeault chimed in.
Who was it that defined insanity as hitting your thumb repeatedly with a hammer, expecting it won’t hurt the next time? And whos paying for all these rescue operations? Mostly the same taxpayers who are also paying for the junk science that insists the entire ice cap will melt away by 2014.
Actually, the Arctic ice has been rebounding since its latest low ebb around September 2007. And despite steadily rising atmospheric carbon dioxide levels - from 0.0285% or 285 ppm in 1870 to 0.0388% or 388 ppm today - average global temperatures have been stable or declining since 1995.
Even UK Climate Research Unit chief Phil Jones and other Climategate emailers acknowledge that now. “We can’t account for the lack of warming, and it’s a travesty that we can’t,” Kevin Trenberth moaned in one of the infamous Climategate emails.
Instead of sleds and snowshoes, the explorers should have rented Doc Brown’s “Back to the Future” time machine. They would have found plenty of the global warming and open waters they so desperately seek.
Vikings built homes, grew crops and raised cattle in Greenland in 950-1300, before they were frozen out by the Little Ice Age and encroaching pack ice and ice sheets.
Many warm periods followed, marked by open seas and minimal southward extent of Arctic sea ice, as noted in ships’ logs and discussed in scientific papers by Torgny Vinje and other experts. The warm periods of 1690-1710, 1750-1780 and 1918-1940, for instance, were often preceded and followed by colder temperatures, severe ice conditions and maximum southward ice packs, as during 1630-1660 and 1790-1830.
“Not only in the summer, but in the winter the ocean [in the Bering Sea region] was free of ice, sometimes with a wide strip of water up to at least 200 miles away from the shore,” Swedish explorer Oscar Nordkvist reported in 1822.
“We were astonished by the total absence of ice in Barrow Strait,” Francis McClintock, captain of the “Fox,” wrote in 1860. “I was here at this time in 1854 - still frozen up - and doubts were entertained as to the possibility of escape.”
In 1903, during the first year of his three-year crossing of the Northwest Passage, Roald Amundsen noted that his party “had made headway with ease,” because ice conditions had been “unusually favorable.”
The 1918-1940 warming also resulted in Atlantic cod increasing in population and expanding their range some 800 miles, to the Upernavik area of Greenland, fisheries biologist Ken Drinkwater has reported.
Global warming and climate change are certainly real. They’ve been real throughout Earth’s history, from the Roman and Medieval Warm Periods, Little Ice Age and Dust Bowl - to countless other cycles of warming and cooling, flood and drought, storm and calm, open Arctic seas and impassable ice.
Humans clearly influence weather and climate - at least on a local scale - through heat and emissions from cities and cars, our clearing of forests and grasslands, our diversion of rivers.
But that is not the issue. Nor is it enough to say - as EPA Administrator Lisa Jackson often does - that “the climate is changing and mankind is responsible in part for that change.” The assertion is simplistic and misleading. It skews the debate, stigmatizes fossil fuel use, and preordains public policy responses that are excessive, costly and unjust. The fundamental issue is this:
Are humans causing imminent, unprecedented, global climate change disasters? And can we prevent those alleged disasters, by dramatically increasing the price of carbon, drastically curtailing hydrocarbon use, slashing living standards, and imposing government control over industries and people’s lives?
On that, the evidence simply is not there - a reality underscored by the glaring fact that the headline-grabbing disasters and nearly one-third of all the citations in the IPCC’s massive 2007 climate report were not peer-reviewed studies. They were newspaper articles, student papers, and even press releases from climate activists and lobbyists.
That leaves us with crisis scenarios conjured up by computer models that reflect CO2-centric assumptions, presume clouds exert only warming influences, and rely on temperature data that come from urban heat islands or have been manipulated by the modelers. In short, the climate models are little better than Farmville or Sim Earth.
They help scientists visualize how climate systems work. But they’re useless for predicting the future. They create virtual realities and virtual crises, and then “solve” them with virtual solutions. We need reality-based science and public policy.
No wonder most Americans now blame climate change on natural forces, not human activity - and 75% are unwilling to spend more than $100 per year in higher energy bills to “stabilize” Earth’s turbulent and unpredictable climate (Rasmussen polls). These citizens display a refreshing dose of commonsense.
See post here.
By Viv Forbes, Carbon Sense Coalition
The Carbon Sense Coalition today called for Sunset Clauses to be inserted in all past and future Global Warming legislation. The Chairman of “Carbon Sense”, Mr Viv Forbes, said that even though the Ration-N-Tax Scheme is on ice, Governments are still wasting billions of dollars to create an artificial global warming industry.
“As an example, the Australian government is spending $800 million per year on climate change research and probably more on carbon geo-sequestration. And every state has its own bloated climate change and energy bureaucracies. Next we are promised the “Mother of all Renewable Energy Schemes” to cost untold billions. There is no doubt that some enlightened or distressed future government will have the distasteful job of taking the well chewed subsidy bones off these greedy and unstainable industry dogs.”
“There is no evidence that man is causing global warming, no evidence that the natural warming we have experienced is dangerous or even unusual, and no chance that politicians can control the climate. It is thus essential that every piece of global warming legislation is subjected to an annual cost-benefit analysis and a sunset clause which triggers repeal within five years, or sooner once it becomes obvious to all that man-made global warming is not a problem. Such a cautionary clause is needed to warn investors and promoters relying on subsidies, market mandates, tax benefits, ethanol subsidies, carbon credits, renewable energy targets or research grants that unsustainable industries are high risk and can only create sub-prime assets. As we have seen with the government roof insulation disaster, it is easier to inflate an artificial industry balloon than it is to let it down gradually.”
-------------------
Comment on the New Zealand Climate Coalition on the Emission Trading Scheme (ETS)
By Dr. Bob Carter
“The madness of the Government’s new carbon tax is that New Zealanders will be the only people in the world paying it. It will drive up the costs of living and undermine the competitiveness of New Zealand business for negligible environmental gain.” Nick Smith - Friday, 25 November 2005
On the 1st July, 2010, New Zealand’s Emissions Trading Scheme (ETS) is to implemented. The ETS is effectively a new tax that will affect most sectors of the New Zealand economy, raising prices for all New Zealanders. It can be estimated it will eventually cost the average New Zealand household about $2500 - $3000 in higher prices (worsened by any increase in the rate of GST). In addition, Sheep and Beef farmers will become liable (at $25/tonne CO2) to $5,200, while Dairy farmers will pay over $10,000 each - with 75% of these levies commencing in July 2010. And then there is the jump in prices of EVERYTHING, followed by higher interest rates!
For what? For no measurable changes to CO2 levels and climate! There are no positives, only negatives for the people of New Zealand.
We join the business and farming communities in calling on the Government to defer the implementation of the ETS given:
- that it has just become known that Australia is deferring the implementation of its ETS scheme until 2013,
- that no other country has put in place any similar scheme,
- that its implementation will severely disadvantage NZ against its trading partners,
- that it will cause unnecessary hardship for a very large number of New Zealanders.
----------------------------
Five new videos - ‘The Emissions Trading Scheme: The Really Inconvenient Truth - For New Zealand’ - are now on YouTube
They can be found at the following links:
Barry Brill, Former Member of Parliament, Minister of Science, and Minister of Energy, and now Chariman of the NZCSC, overviews a brief history of the ETS and addresses its downsides.Barry Brill - 7 mins.
Professor Bob Carter from James Cook University (Queensland) provides a 20 minute interview about his new book - Climate: the Counter-Consensus * - in which he distinguishes three different aspects of the public discussion of climate change as corresponding to science reality, virtual reality (computer models) and socio-political reality. These distinctions have important scientific and policy implications, yet until recently they were absent from the public debate. Prof Bob Carter PART 1 - 10 mins. Prof Bob Carter PART 2 - 10 mins.
Dr Jock Allison, Former Director of the MAF Invermay Research Centre and critically involved in recent improvements to the NZ sheep industry, addresses the effect the ETS will have on Agriculture. Dr Jock Allison - 10 mins -
Bryan Leyland, is a consulting engineer specializing in electricity generation and transmission, and speaks to the effect of the ETS on the power industry. Bryan Leyland - 6 mins.
Please watch the videos and spread this message far and wide! Forward it to all who will be interested
and even those who are not! If they live in NZ, they will be affected by the ETS! Or...’Cut and paste and pass along’...to all and sundry.
If you are concerned about the imposition of this totally unnecessary tax on the people of New Zealand, be sure to contact the National Government Caucus through a web page such as this one and let them know in no uncertain terms what you think. It is very very simple to email all National Government members through this webpage.
See also this John O’Sullivan story on KIWI as a Carbon Copy of Climategate.
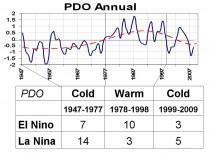
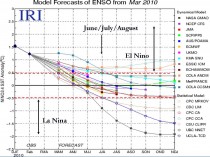
By Joseph D’Aleo, CCM
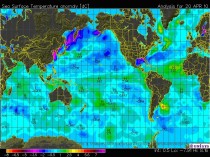
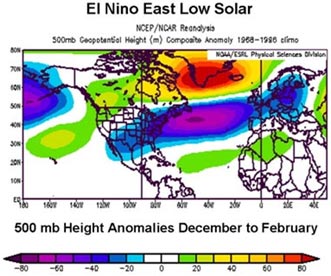
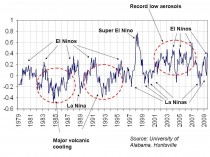
El Nino is still hanging on but likely not for very long. Warmer than normal water can still be seen along the equator in the tropical Pacific. It is even warmer in the sub-tropical North Atlantic because of the suppressed winter jet stream and subtropical high which meant lighter than normal winds and less clouds.
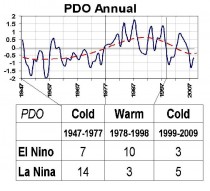
Signs of the demise of the El Nino are numerous. It is likely given the flip of the PDO which favors shorter El Ninos and stronger, more frequent and lengthy La Ninas that a moderate to strong La Nina is next in the cards this year and next.
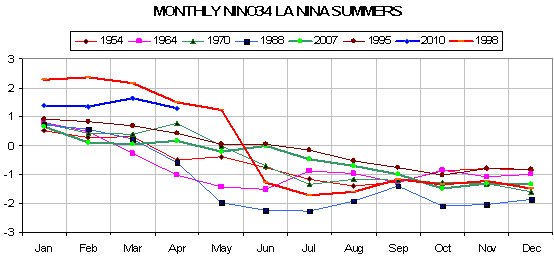
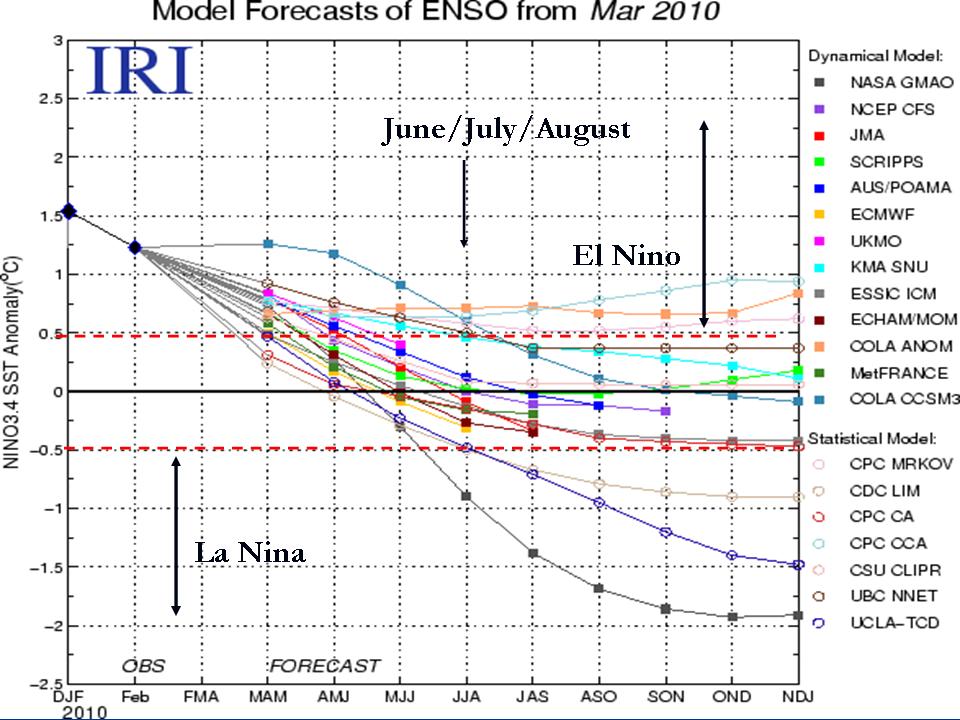
Notice in the temperature anomaly plot for NINO region 34 (region shown on the CDC map below)
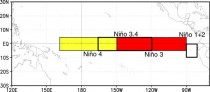
how we are somewhere between 1998’s super El Nino and a cluster of more moderate ones and how they declined quickly by the summer on the graph that follows (enlarged here). Values are given in STD of NINO 34 SSTA.
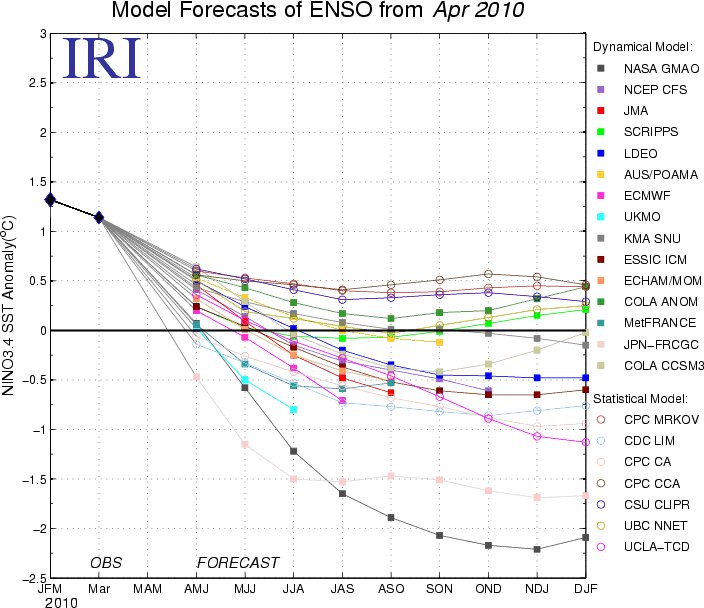
ENSO models, both dynamical (coupled air and ocean models) and statistical suggest a rapid cooling with all models dropping below threshold El Nino levels by summer (JJA - June-July-August) and perhaps half reaching La Nina values by summer or fall. As it declines, the Pacific Decadal OScillation will decline negative again as NOAA CDC models suggest.
In the depth cross section across the entire tropical Pacific that is built from the TAO-Triton buoy data, we can see the warm water in the eastern top water which was 5C above normal has diminished as the water mixes with cooler surface water and the thermocline is lifted. Notice the developing strong cold pool not unlike that in 1998 at 100 meters across most of the Pacific. Notice the amazing cool down of NINO34 in 1998 from May to June in the multiyear graph above.
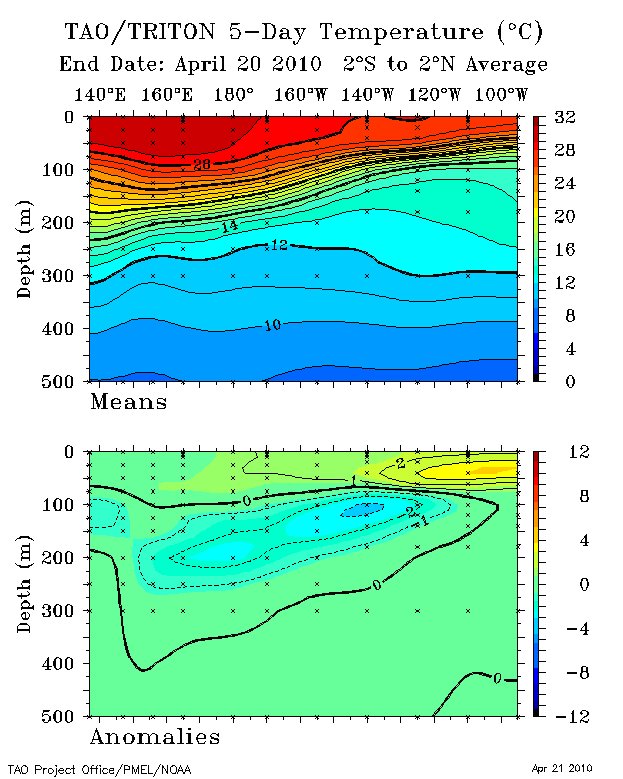
The El Nino followed two years of La Nina with below normal temperatures in NINO34 and in much of the Pacific leading to below normal ocean heat content in the tropical eastern half of the Pacific. A strong La Nina in 2007/08 was followed by a summer rebound then another dip in January.
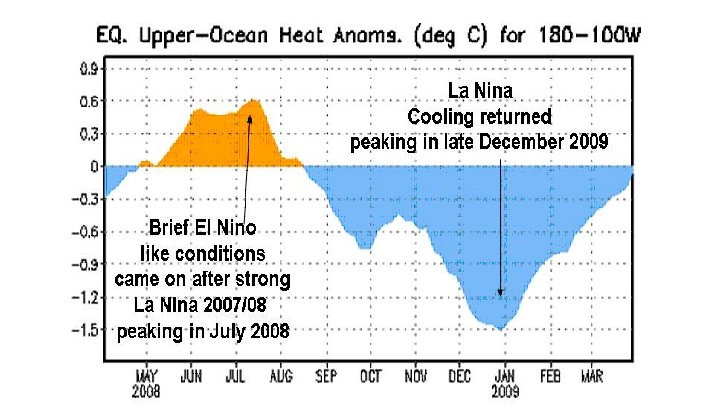

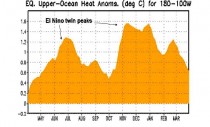
We can see in the heat content the last year, a peak last summer a fall decline and then a multi peak winter warming fed by westerly wind bursts this past winter, notice the decline as we started April.
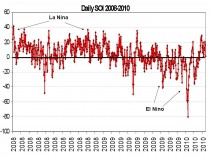
The Southern Oscillation Index which was in positive La Nina territory in 2007/08 and 2008/09 dropped into negative El Nino territory reaching an incredible 8 STDs in early 2010. It has rebounded to positive and usually leads the change of ENSO state by a few months given credence to a return of La Nina.
See much more on the possible implications for the summer and following winter (with recognition of the possible influence of the solar and volcano wildcards) here.
--------------------------
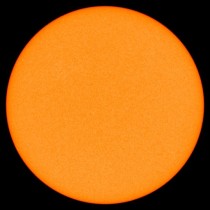
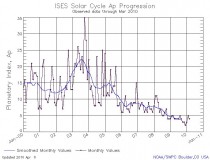
Sun back in a mini-slumber in the transition between solar cycles 23 and 24
The sun is back in a mini-slumber with 13 straight sunspotless days as of April 27 and now 790 for the transition from cycle 23 to 24 (the last 4 cycle transitions had between 220 and 310 such days).
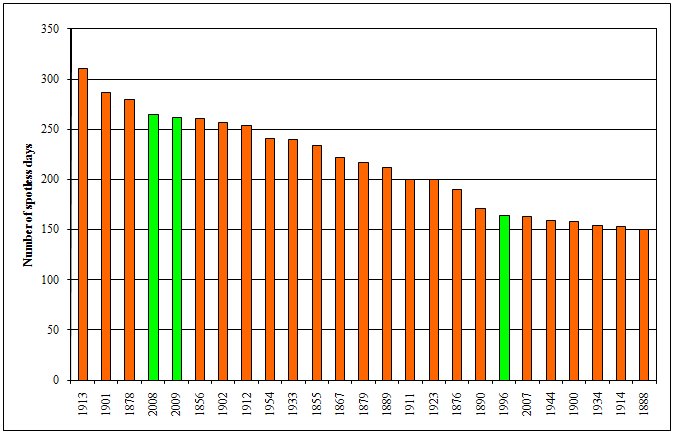
The last two years were 4th and 5th on the list of most sunpotless years since 1849 (below, enlarged here).
One has to wonder how many of the microdots that were counted as spots the last few years would have been seen 100 years ago. This site has an alternative count that thresholds the size.
Here is a brief section of Rupert Wyndham’s book most relevant to the topic:
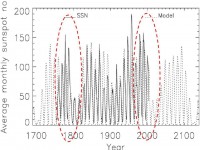
The average length of solar cycles, from minimum to minimum, is 11 years. The solar minimum between cycles 23 and 24 occurred in December 2008, making cycle 23, at 12.5 years long, the longest since 1823. However, the sun remained in a quiescent state through most of 2009, with only intermittent cycle 24 sunspots occurring; by the end of 2009 there had been 771 days without sunspots during the transition.
It is established from observation that solar cycles longer than the 11 year average are followed by later cycles of lesser intensity, and, commensurately, a cooler climate[ii]. Solar Cycle 23 was 3 years longer than Cycle 22. Based on the theory originally proposed by Friis-Christensen and Lassen, this implies that cooling of up to 2.20 C may occur during Cycle 24 (compared with temperatures during Cycle 23) for the mid-latitude grain-growing areas of the northern hemisphere[iii].
The Average Planetary Magnetic Index (AP index) is a commonly used yardstick to indicate the earth’s magnetic condition and its close relation to solar magnetic variability. Historically, this index recorded a lowest monthly value of 4 in January, 1932 - until recently. Between November, 2008, and September, 2009, the AP index returned persistent readings of 4’s and 5’s, sinking to 3’s in October and November, and finally to 1 in December - which is the lowest reading in the 165 years of observations since 1844[iv].
At the same time that the sun’s magnetic field was setting new record lows, the Northern Hemisphere winter turned into one of the most severe in decades. It was therefore not surprising that during 2009 NASA’s chief solar scientist, Dr David Hathaway, commented that “something like the Dalton Minimum - two solar cycles in the early 1800s that peaked at about an average of 50 sunspots - lies in the realm of the possible"[v]. Given the implications of the recurrence of the cold conditions that characterised the Dalton Minimum, it is, however, astonishing that the IPCC, and the governments that it advises, continue to ignore the implications of the cycle 23/24 solar transition, and the now probable outcome of significant cooling and decrease of crop yields over the next few decades.
---------------
Marshall Space Flight Center, NASA, 2010. Solar Cycle Prediction (Updated 2010/01/04).
[ii] Friis-Christensen, E. & Lassen, K., 1991. Length of the Solar Cycle: An Indicator of Solar Activity Closely Associated with Climate. Science 254, 698700, doi: 10.1126/science.254.5032.698.
Archibald, D., 2006. Solar Cycles 24 & 25 and predicted climate response. Energy and Environment 17, 29-38.
Archibald, D, 2007. Climate outlook to 2030. Energy and Environment 18, 615-619.
Butler, C.J. & Johnston, D.J., 1996. A provisional long mean air temperature series for Armagh Observatory. Irish Astronomical Journal 21, 251-273.
Clilverd, M.A., Clarke, E., Ulrich, T., Rishbeth, H. & Jarvis, M.J., 2006. Predicting Solar Cycle 24 and beyond. Space Weather 4, S09005, doi:10.1029/2005SW000207.
[iii] Archibald, D., 2010 (Feb. 3rd). Solar Cycle 24 Update. .
[iv]Watts, A., 2010 (Jan. 7). Solar geomagnetic index reaches unprecedented low - only “zero” could be lower - in a month when sunspots became more active.
[v]Archibald, D., 2009. NASA now saying that a Dalton Minimum repeat is possible. July 29, 2009, Solar Cycle 25.
By Jim McElhatton
Employee misconduct investigations, often involving workers accessing pornography from their government computers, grew sixfold last year inside the taxpayer-funded foundation that doles out billions of dollars of scientific research grants, according to budget documents and other records obtained by The Washington Times. The problems at the National Science Foundation (NSF) were so pervasive they swamped the agency’s inspector general and forced the internal watchdog to cut back on its primary mission of investigating grant fraud and recovering misspent tax dollars.
“To manage this dramatic increase without an increase in staff required us to significantly reduce our efforts to investigate grant fraud,” the inspector general recently told Congress in a budget request. “We anticipate a significant decline in investigative recoveries and prosecutions in coming years as a direct result.” The budget request doesn’t state the nature or number of the misconduct cases, but records obtained by The Times through the Freedom of Information Act laid bare the extent of the well-publicized porn problem inside the government-backed foundation.
For instance, one senior executive spent at least 331 days looking at pornography on his government computer and chatting online with nude or partially clad women without being detected, the records show. When finally caught, the NSF official retired. He even offered, among other explanations, a humanitarian defense, suggesting that he frequented the porn sites to provide a living to the poor overseas women. Investigators put the cost to taxpayers of the senior official’s porn surfing at between $13,800 and about $58,000.
“He explained that these young women are from poor countries and need to make money to help their parents and this site helps them do that,” investigators wrote in a memo. The independent foundation, funded by taxpayers to the tune of $6 billion in 2008, is tasked with handing out scientific grants to colleges, universities and research institutions nationwide. The projects it funds ranges from mapping the genome of the potato to exploring outer space with powerful new telescopes. It has a total of 1,200 career employees.
Recent budget documents for the inspector general cite a “6-fold increase in employee misconduct cases and associated proactive management implication report activities.” The document doesn’t say how many cases were involved in the increase, and officials could not immediately provide a figure. See story here.
It is sadly ironic that the NSF which is responsible for funding climate porn is so involved
-------------------
On “Who Says Global Warming Is a Scam?” ABC Filters Out Comments
ABC Nightline posted a story “Who Says Global Warming Is a Scam?” here. It was summarized:
More than one in four weathercasters, according to this recent study from George Mason University and the University of Texas, which also found a nearly even split among meteorologists who believe in global warming at all and those who do not. Tonight, as Earth Day turns 40, the plan is for correspondent David Wright and producer Max Culhane to take a closer look at what many may consider a surprising level of skepticism the people trusted to deliver our daily weather report have in the scientists who study climatology.
Basically, what’s the disconnect? Why does it exist? And is it potentially dangerous for a television meteorologist to disregard global warming while informing the public about weather? Notably, while a broad majority of Americans—72 percent—believe global warming is for real, that number has dipped from a 2006 high of 85 percent, according to the most recent ABC News/Washington Post poll on the issue. A note, however, from our polling director Gary Langer, who wrote this blog at the time about the political forces behind the decline—namely Republicans and conservatives who may be basing an answer to a question of science on a partisan policy perspective.
ICECAP NOTE: That obvious bogus polling information and blaming republicans and conservatives by the pollster for the decline led me to submit a comment. It appeared on the site for a short while, then was moderated out. i repeated it a second time. Same results. Here is what I said. I did a screen capture to show it was viewable on the page for a short while.
“In Public Strategies Inc./POLITICO poll, just 4 percent of Americans ranked climate change as the top issue. In a Pew Research Center poll last October among all Americans, only 36% blame humans for any climate change. In a Pew poll in January 2009, the public ranked dealing with global warming last in a group of 20 priority issues.
In the December Rasmussen survey, 59% of Americans said it was at least somewhat likely that some scientists have falsified research data to support their own theories and beliefs about global warming. That number included 35% who said it was very likely. Nearly half of voters (48%) believe global warming is caused primarily by long-term planetary trends while just 33% blame the problem on human activity. A majority (54 percent) believe the media exaggerates the dangers of global warming.
In 2008, a panel of economists meeting in Copenhagen ranked Climate change research and mitigation 29th and 30th in a list of 30 issues the world should spend resources on.
In the George Mason survey of broadcasters mentioned about one-third (31%) reported that global warming is caused mostly by human activities, while almost two-thirds (63%) reported it is caused mostly by natural changes in the environment.
The change in public opinion is real and isnt politically driven. It is the result of climategate revelations and emerging evidence that CRU, NASA and NOAA are cooking the books in attempting to keep the funding going for them and their university friends. Natural factors like the sun and multidedecadal ocean cycles are the real climate drivers. CO2 is not a pollutant but a valuable plant fertilizer.
Wake up America, or you will find them picking your pockets once again in the name of saving the planet. Actually all you will be doing is making big NGOs and other corporations richer at our expense and supporting big government programs based on a ‘scam’ the MSM is complicit in. Who says it is a scam. Well at least 31,000 scientists who endorsed the Petition Project and the 1000 scientists who will converge on Chicago in May from over 20 countries for the International Conference on Climate Change.
------------------------
Utah Record Cold Temperatures Disappear
By Bruce Hall, Hall of Record
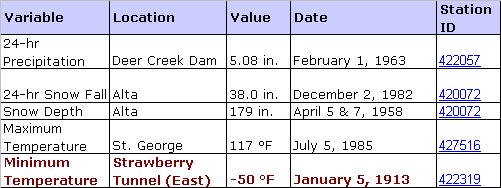
Previously, I reported that NOAA/NCDC has a committee to determine all-time statewide weather records. This web page was added to the NOAA system and allows individuals to look at the approved records. While there have been some minor changes in a few states, the change to the record minimum temperature in Utah is rather dramatic ... it is now 19 degree warmer!
From NOAA:
An un-official temperature of -62 F at Middle Sink, UT was reported by the Utah State Climatologist on Jan 30th, 2002. Middle Sink, UT is located in the upper reached of the Logan river drainage between Logan and Bear Lake. If this reading is accepted as an official record this would be a new January record low for Utah. The current January record is -50 F set at Strawberry East in 1950. The all time record low was set at Peter’s Sink at -69 F on February 1, 1985.
From the new U.S. State Climate Extremes Committee webpage for Utah (enlarged here):

I’ve requested clarification from NOAA. Right now, I do not have a “warm and fuzzy feeling” about the integrity of the data. See post here.
-----------------------
Prominent Climategate Figure Threatens Lawsuit over Spoof Video
Jeff Davis, No Cap and Trade Coalition
Washington, DC - Penn State University’s Michael Mann, one of the central figures in the Climategate scandal, has threatened legal action against Minnesotans for Global Warming (M4GW) over the group’s popular satirical YouTube video “Hide the Decline.” The No Cap-and-Trade Coalition, a group that includes M4GW, responded today at an event at the National Press Club, releasing Mann’s threatening letter and an updated version of the “Hide the Decline” video. “We understand why Michael Mann is eager to silence public discussion of the hockey stick scandal,” said Jeff Davis of No Cap-and-Trade, “but truth is an absolute defense.”
The original “Hide the Decline” video, which had more than 500,000 viewers, was removed today from YouTube by M4GW’s Elmer Beauregard. It received national attention when Rush Limbaugh played it on his radio show and was later featured on CBS Evening News in the wake of the Climategate email scandal. “Hide the Decline” parodied Mann, the Penn State professor who is largely responsible for the creation of the now debunked “hockey stick” graph, which purported to show a dramatic spike in average global temperature during the 20th century after 900 years of relatively constant temperature.
“The video spotlighted a phrase from one of the central “Climategate” e-mails in which the University of East Anglia’s Phil Jones explains how he used Mann’s “Nature trick” to “hide the decline” of key temperature data. The hockey stick graph relied on “hiding this decline.”
When asked why he removed the video, Beauregard said “Right now, the last thing I need is a lawsuit. I can barely afford my electric bill.” Beauregard recently converted M4GW’s world headquarters (a recreational vehicle parked in Northern Minnesota) from propane to wood heat. “Mann should be glad to know that we don’t burn fossil fuels anymore - just trees,” said Beauregard. “M4GW was started to poke fun at Global Warming because I knew it was a joke, it’s hard to believe in Global Warming when you live in a place like Minnesota. During last winter we all wished we had some global warming, hence the name of our group,” said Beauregard. As global warming developed into a political issue, M4GW has tried to educate the public that CO2 is not harmful but part of the natural carbon cycle.
Minnesotans for Global Warming did comply with Mann’s cease and desist demand, taking the “Hide the Decline” video down from their YouTube account and webpage. The No Cap and Trade Coalition unveiled a new video they’re calling “Hide the Decline 2,” however. It was screened at a press conference on April 20th and is available on YouTube and NoCapAndTrade.com.
“If Doctor Mann decides to sue,” said Davis, “we would welcome the opportunity to do legal discovery. I believe he’s hiding more than just ‘the decline.’”
Speaking at the No Cap-and-Trade Coalition press conference was M4GW spokesman “Chicken Little,” a man in a chicken suit who goes to rallies crying “The globe is warming, the globe is warming!” When asked about the situation, Chicken Little said, “I used to believe in global warming - of course, I used to believe the sky was falling too, but Elmer set me straight.” Chicken Little went on to say, “I think it’s horrible that Elmer had to take down the video. Can’t a person have a little fun on YouTube anymore? Those Global warming guys sure don’t have any sense of humor.”
At the press conference, the No Cap-and-Trade Coalition handed out a historical review of the hide-the-decline controversy entitled, “Michael Mann: Defamed or Defined by Hide-the-Decline?” as well as mini-hockey sticks that read “Mann-Made Global Warming: Why We Should Be Worried About the Intellectual Climate.” Both versions of the “Hide The Decline” video can be viewed here . See the M4GW post here. See the new video lyrics here. New video below (Youtube removed it with a bogus rights claim, but it is available here from No Cap and Trade.
By Victoria Gill, Science reporter, BBC News
Climate change is causing a breed of wild sheep in Scotland to shrink, according to research.`Scientists say milder winters help smaller sheep to survive, resulting in this “paradoxical decrease in size”.

Classic evolutionary theory would predict that wild sheep gradually get bigger, as the stronger, larger animals survive into adulthood and reproduce. Reporting in Science journal, the team says this shows the “subtle interplay” between evolution and the environment. Scientists first began studying Soay sheep, on the island of Hirta in the St Kilda archipelago, in 1985.
Since then, the sheep have decreased in size by 5% - their legs getting steadily shorter and their body weight decreasing. This strange phenomenon was first reported in 2007, but the reason for it remained under debate.
A natural laboratory’
The lead researcher in the study, Tim Coulson from Imperial College London, said the island provided an ideal opportunity to tease apart the factors driving the sheep’s physical change. “The island is almost like a natural laboratory - there are only the sheep and the vegetation there,” he said. `He and his team had access to detailed information about the sheep that had been collected over more than two decades. “We have so much great data,” said Professor Coulson, “that we were able to write a ledger of how much of an effect each of the different factors had on the sheep.” They used a formula called the “Price equation”, which was designed by evolutionary theorist George Price to predict how a physical trait, such as body size, will change from one generation to the next.
With all of this data, the team was able to “rearrange the equation” and use it to work out how much of a contribution each driver made to the sheep’s body size. They found that the local environment had a stronger effect on the animals than the evolutionary pressure to grow larger. “In the past, only the big, healthy sheep and large lambs that had piled on weight in their first summer could survive the harsh winters on Hirta,” said Professor Coulson.
Because of climate change, he explained, grass for food is now available for more months of the year on the island. “Survival conditions are not so challenging - even the slower growing sheep have a chance of making it, and this means smaller individuals are becoming increasingly prevalent in the population,” he said.
“Young mums” tend to give birth to smaller lambs
The team also found that younger sheep tended to give birth to smaller lambs - a phenomenon they termed “the young mum effect”. This effect, said Professor Coulson, combined with environmental changes had “overriden what we would expect through natural selection”. As for the future of the sheep, the team believes that they are still shrinking.
“The next step is to extend our description of past change into a predictive model,” said Professor Coulson. “But it’s too early to say if, in 100 years, we will have chihuahuas herding pocket-sized sheep.” See more here.
The last few years have seen a sharp decline in temperatures in Scotland with very heavy snows. This past winter was the coldest since 1962/63. If this trend continues, will the next generation of sheep be more like moose? Will this be Sheepgate? Only one comment possible ....baaah humbug.
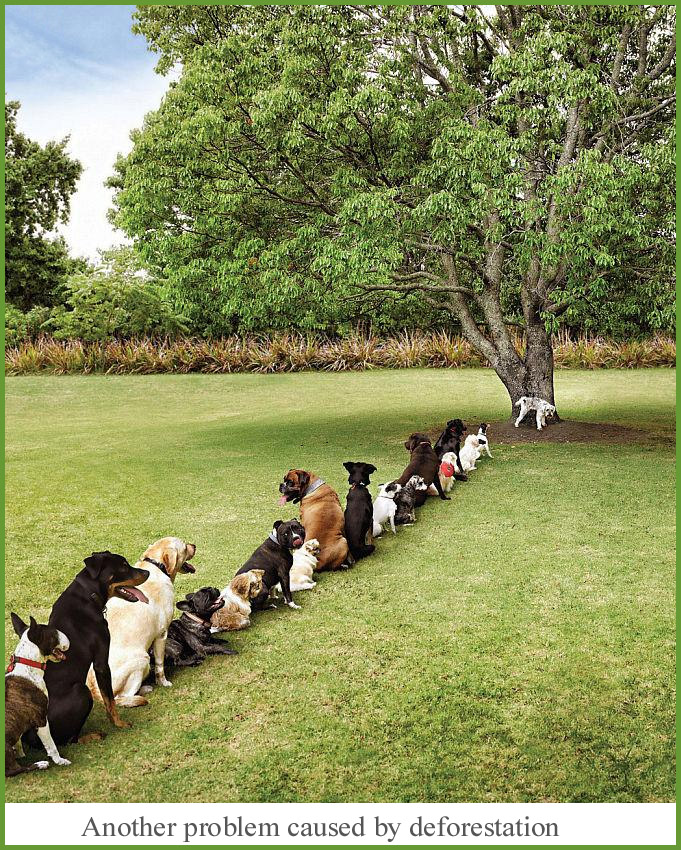
Another Problem Caused by Deforestation

See larger image here.
This paper is, as intended, a work in progress as a compilation of what’s current and important relative to the data sets used for formulating and implementing unprecedented policy decisions seeking a radical transformation of our society and institutions.
It was necessitated by the extraordinary revelations in the recently released CRU emails, including the admissions of Ian “Harry” Harris, the CRU programmer. He lamented about “[The] hopeless state of their (CRU) database. No uniform data integrity, it’s just a catalogue of issues that continue to grow as they’re found” and “Aarrggghhh! There truly is no end in sight. This whole project is SUCH A MESS. No wonder I needed therapy!!”
CRU’s Phil Jones, candidly confessed in a BBC interview that “his surface temperature data are in such disarray they probably cannot be verified or replicated.”
This reflects on both NOAA and NASA in the United States. Phil Jones also admits that “Almost all the data we have in the CRU archive is exactly the same as in the GHCN archive used by the NOAA National Climatic Data Center” and that NASA’s GISS uses the GHCN, applying its own adjustments, as it explains: “The current analysis uses surface air temperatures measurements from the following datasets: the unadjusted data of the Global Historical Climatology Network (Peterson and Vose, 1997 and 1998), United States Historical Climatology Network (USHCN) data, and SCAR (Scientific Committee on Antarctic Research) data from Antarctic stations.”
The first version of this paper inspired and motivated others toward a more in depth look into the data and methodology - a positive and welcome development long overdue. It is now essential that there be carried out an independent review of NOAA data methods and quality control procedures, such as is in process within CRU. This and any future versions of this paper include additional findings, corrections and enhancements based on feedback and constructive discussion.
Much attention and comment has focused on the station dropout issue. The loss of stations in the USA and worldwide is a real issue that NOAA does not dispute. NOAA claims that by focusing on temperature anomalies instead of actual temperatures the problem is resolved. In places with a reasonable density of stations, a random station dropout would likely not affect anomalies but where the data is already sparse or where the dropout was biased towards a certain character station, biases can be real and even significant. Further study is needed. Examples are provided.
This does not mitigate the fact that missing data (40% of GHCN is missing at least one month of data), poor station siting (90% of the over 1000 US climate stations out of 1221 network) and urbanization all contaminate data toward a warming bias. Over a dozen recent peer reviewed papers (including one by Dr. Phil Jones) have shown this to be the case. Dr. Jones showed a urban data contamination of 1C per century for China. The update to this paper provides more details and additional case studies attesting to a biased outcome.
In the words of two scientists frequently mentioned in the paper, we need:
“...independent groups doing new and independent global temperature analyses - not international committees of Nobel laureates passing down opinions on tablets of stone.” (Roy Spencer)
and
“...an inclusive assessment of the surface temperature record of CRU, GISS and NCDC. We need to focus on the science issues. This necessarily should involve all research investigators who are working on this topic, with formal assessments chaired and paneled by mutually agreed to climate scientists who do not have a vested interest in the outcome of the evaluations.” (Roger Pielke Sr.)
See paper here.
Icecap Staff
This week marks our third anniversary. Sixteen million times in the last three years people like you have come to us to get behind the headlines and find the story behind the story. For that we are grateful. You won’t get it from the status quo television networks, newspapers and magazines. We have posted 4000 stories since inception, many insightful, thought provoking scientific postings from some of the leading climate experts in the world dispelling some aspect of the alarmist’s agenda. We strive to bring the truth about climate out of the shadows and into the clear light of day without compromise.
![]()
In the last few months, your donations have helped produce videos of scientists for use in KUSI specials and John Coleman’s blogsite, helped find the time to educate and work with senators and congressmen. We have worked with Watts Up With That’s Anthony Watts and SPPI to update a long paper and compile international case studies on the data issue (updated today here. We have responded to suggestions and constructive criticism on the paper in the revised edition. It accomplished what we hoped. It has created awareness that the data issues are not limited to CRU and has helped spark research and analysis on other blogs that has moved the ball forward in our understanding of the issues. It has sparked research studies on the UHI published on SPPI and summarized on ICECAP. We have worked on a paper on the ocean cycles effect on climate for a journal hopefully to be published soon.
We continue to make presentations on cable, local television, in schools, colleges, libraries, clubs, and groups. As the story on ACE posted today here showed, we need to do even more. An educated electorate and populace is our only defense. We have new momentum and public opinion on our side but the alarmist’s are receiving billions of dollars from their determined supporters to keep the movement alive and the government does not seem to care about public opinion.
The EPA is moving forward with its plans to regulate carbon dioxide. Although it will face court challenges, it is a future threat to our economy. Congress is heading down a path of its own. Hidden in the bills under consideration, the government even as it talks green jobs, is planning stealth taxes on everyone by taxing the production of carbon dioxide and pushing an alternative energy solution that has proven to be a dismal failure and job killer where it has been tried in Europe and elsewhere. While claiming they are opening up the offshore waters for drilling, their plans accomplish the opposite, blocking or delaying it or favoring it in places where the infrastructure doesn’t yet exist to support it, even as Russia slant drills to get our oil and gas off Alaska, China from Cuba off Florida and the Chinese buy up the shale gas from Canada once destined for our use. Just when our economy is showing signs of life the current powerbrokers in Washington want to snuff it out. They are using climate change to fund their re-inventing of America.
Unlike the alarmist sites, which receive significant support from the modern opportunistic enviro groups, rich individuals, foundations (see recent story on the $900 million given to climate change in 2009) or communications groups with vested interest in propagating this new political agenda or money making carbon trading/control or alternative energy schemes, the climate realist blogs mostly depend on donations from individuals. See how the NGO’s and UN approved CSO’s have been abusing the system here.
Like the other realist sites, we have to depend on other side businesses or consulting to pay the bills and that is a struggle. We would dearly love to generate enough support for ICECAP to allow the principles to devote more time to these important efforts and like ACE do more in the schools but in this case to un-indoctrinate the young people.
Whether you are associated with a foundation or just an appreciative individual, your donation, large or small is as always much appreciated. ICECAP is a C3 organizations which means your donations are fully tax deductible. Donate button on the left or if your prefer to donate by check via snail mail write me at jsdaleo@yahoo.com for an address. Write us there if you want to help in other ways, by presenting in front of groups, providing materials for the schools, etc.
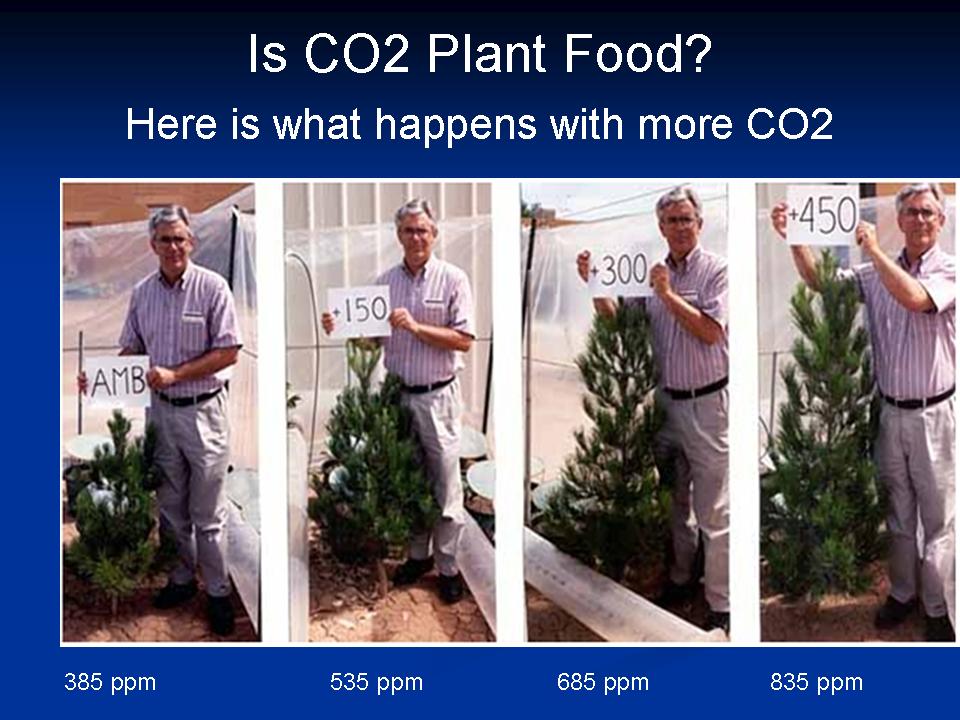
CO2 Science
CO2 is not a pollutant but a plant fertilizer. It should not be controlled but welcomed.
Isolated for 42 days in chambers of ambient and elevated CO2 concentrations, we periodically document the growth of cowpea plants (Vigna unguiculata) via time-lapse photography.
Another example below (enlarged here).

-----------------------
Earth is never in equilibrium
By Dr. Richard S. Lindzen
CAMBRIDGE, MASS. - EDITOR’S NOTE: The writer is addressing the question, Is climate change real?
To a significant extent, the issue of climate change revolves around the elevation of the commonplace to the ancient level of ominous omen. In a world where climate change has always been the norm, climate change is now taken as punishment for sinful levels of consumption. In a world where we experience temperature changes of tens of degrees in a single day, we treat changes of a few tenths of a degree in some statistical residue, known as the global mean temperature anomaly (GATA), as portents of disaster.
Earth has had ice ages and warmer periods when alligators were found in Spitzbergen. Ice ages have occurred in a 100,000-year cycle for the last 700,000 years, and there have been previous interglacials that appear to have been warmer than the present despite lower carbon-dioxide levels. More recently, we have had the medieval warm period and the little ice age. During the latter, alpine glaciers advanced to the chagrin of overrun villages. Since the beginning of the 19th century, these glaciers have been retreating. Frankly, we don’t fully understand either the advance or the retreat, and, indeed, some alpine glaciers are advancing again.
For small changes in GATA, there is no need for any external cause. Earth is never exactly in equilibrium. The motions of the massive oceans where heat is moved between deep layers and the surface provides variability on time scales from years to centuries. Examples include El Nino, the Pacific Decadal Oscillation, the Atlantic Multi-decadal Oscillation, etc. Recent work suggests that this variability is enough to account for all change in the globally averaged temperature anomaly since the 19th century. To be sure, mans emissions of carbon dioxide must have some impact. The question of importance, however, is how much.
A generally accepted answer is that a doubling of carbon dioxide in the atmosphere (it turns out that one gets the same value for a doubling regardless of what value one starts from) would perturb the energy balance of Earth about 2 percent, and this would produce about 2 degrees Fahrenheit warming in the absence of feedbacks. The observed warming over the past century, even if it were all due to increases in carbon dioxide, would not imply any greater warming.
However, current climate models do predict that a doubling of carbon dioxide might produce more warming: from 3.6 degrees F to 9 degrees F or more. They do so because within these models the far more important radiative substances, water vapor and clouds, act to greatly amplify whatever an increase in carbon dioxide might do. This is known as positive feedback. Thus, if adding carbon dioxide reduces the ability of the earth system to cool by emitting thermal radiation to space, the positive feedbacks will further reduce this ability.
It is again acknowledged that such processes are poorly handled in current models, and there is substantial evidence that the feedbacks may actually be negative rather than positive. Citing but one example, 2.5 billion years ago the suns brightness was 20 percent to 30 percent less than it is today (compared to the 2 percent change in energy balance associated with a doubling of carbon-dioxide levels) yet the oceans were unfrozen and the temperatures appear to have been similar to today’s.
This was referred to by Carl Sagan as the Early Faint Sun Paradox. For 30 years, there has been an unsuccessful search for a greenhouse gas resolution of the paradox, but it turns out that a modest negative feedback from clouds is entirely adequate. With the positive feedback in current models, the resolution would be essentially impossible.
Interestingly, according to the U.N.’s Intergovernmental Panel on Climate Change, the greenhouse forcing from manmade gases is already about 86 percent of what one expects from a doubling of carbon dioxide (with about half coming from methane, nitrous oxide, freons, and ozone). Thus, these models should show much more warming than has been observed. The reason they don’t is that they have arbitrarily removed the difference and attributed this to essentially unknown aerosols.
The IPCC claim that most of the recent warming (since the 1950s) is due to man assumed that current models adequately accounted for natural internal variability. The failure of these models to anticipate the fact that there has been no statistically significant warming for the past 14 years or so contradicts this assumption. This has been acknowledged by major modeling groups in England and Germany.
However, the modelers chose not to stress this. Rather they suggested that the models could be further corrected, and that warming would resume by 2009, 2013, or even 2030.
Global warming enthusiasts have responded to the absence of warming in recent years by arguing that the past decade has been the warmest on record. We are still speaking of tenths of a degree, and the records themselves have come into question. Since we are, according to these records, in a relatively warm period, it is not surprising that the past decade was the warmest on record. This in no way contradicts the absence of increasing temperatures for over a decade.
Given that the evidence (and I have noted only a few of many pieces of evidence) suggests that anthropogenic warming has been greatly exaggerated, so too is the basis for alarm. However, the case for alarm would still be weak even if anthropogenic global warming were significant. Polar bears, arctic summer sea ice, regional droughts and floods, coral bleaching, hurricanes, alpine glaciers, malaria, etc., all depend not on GATA but on a huge number of regional variables including temperature, humidity, cloud cover, precipitation, and direction and magnitude of wind and the state of the ocean.
The fact that some models suggest changes in alarming phenomena will accompany global warming does not logically imply that changes in these phenomena imply global warming. This is not to say that disasters will not occur; they always have occurred, and this will not change in the future. Fighting global warming with symbolic gestures will certainly not change this. However, history tells us that greater wealth and development can profoundly increase our resilience.
One may ask why there has been the astounding upsurge in alarmism in the past four years. When an issue like global warming is around for more than 20 years, numerous agendas are developed to exploit the issue. The interests of the environmental movement in acquiring more power, influence and donations are reasonably clear. So, too, are the interests of bureaucrats for whom control of carbon dioxide is a dream come true. After all, carbon dioxide is a product of breathing itself.
Politicians can see the possibility of taxation that will be cheerfully accepted to save Earth. Nations see how to exploit this issue in order to gain competitive advantages. So do private firms. The case of Enron (a now bankrupt Texas energy firm) is illustrative. Before disintegrating in a pyrotechnic display of unscrupulous manipulation, Enron was one of the most intense lobbyists for Kyoto. It had hoped to become a trading firm dealing in carbon-emission rights. This was no small hope. These rights are likely to amount to trillions of dollars, and the commissions will run into many billions.
It is probably no accident that Al Gore himself is associated with such activities. The sale of indulgences is already in full swing with organizations selling offsets to one’s carbon footprint while sometimes acknowledging that the offsets are irrelevant. The possibilities for corruption are immense.
Finally, there are the well-meaning individuals who believe that in accepting the alarmist view of climate change, they are displaying intelligence and virtue. For them, psychic welfare is at stake.
Clearly, the possibility that warming may have ceased could provoke a sense of urgency. For those committed to the more venal agendas, the need to act soon, before the public appreciates the situation, is real indeed. However, the need to courageously resist hysteria is equally clear. Wasting resources on symbolically fighting ever-present climate change is no substitute for prudence. See story here.
Richard S. Lindzen is the Alfred P. Sloan professor of atmospheric science at MIT
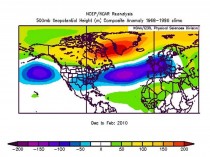
By Joseph D’Aleo
The pop in global temperatures, even the satellite lower troposphere, the last few months seems surprising to some in the Northern Hemisphere where the winter was hard. In Russia, it may have been the coldest on record, while across northern China, Europe and the southern and central United States, it was the coldest since the late 1970s or even the early 1960s. It was not unexpected. In the late fall, we showed the following upper level anomaly pattern was likely for the winter given the low solar, El Nino and developing east Quasi-Biennial Oscillation or QBO (shown in research by our own Climate Prediction Center to modulate solar and El Nino Southern Oscillation or ENSO) (enlarged here).
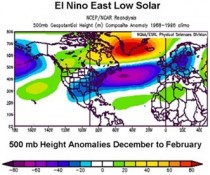
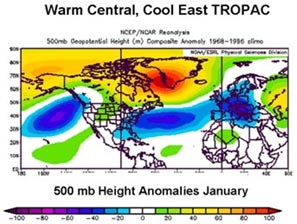
Also the warmest water in the Pacific was biased towards the central Pacific most of the winter. This pattern given the name Modoki, produces this very similar pattern in winter (enlarged here).
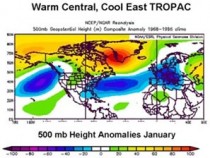
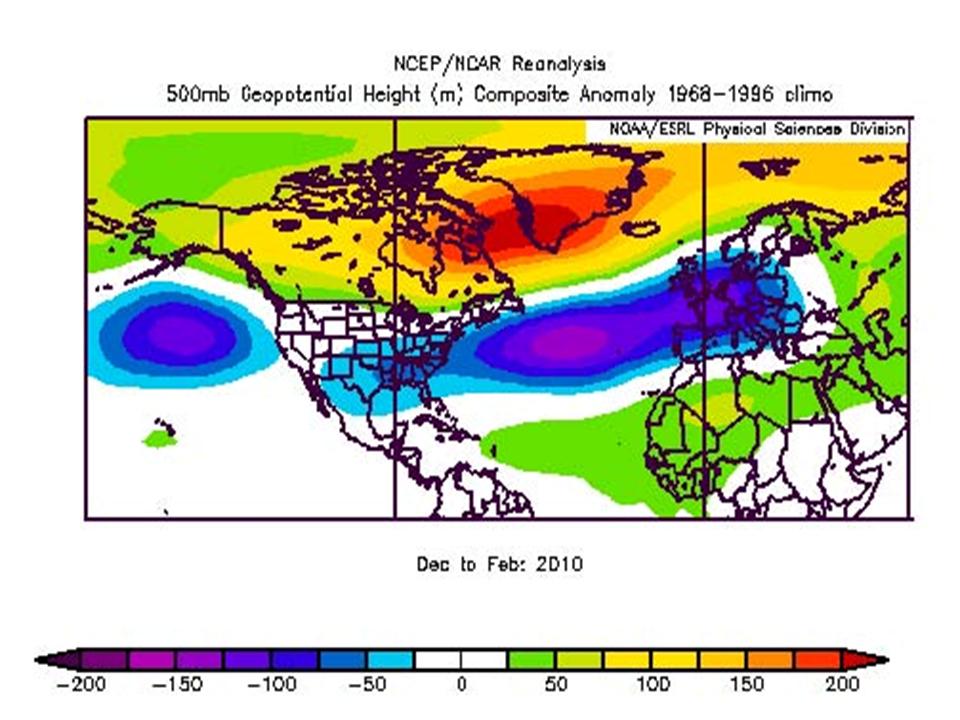
See how well the actual winter 500mb anomalies correlated to the two patterns (enlarged here).
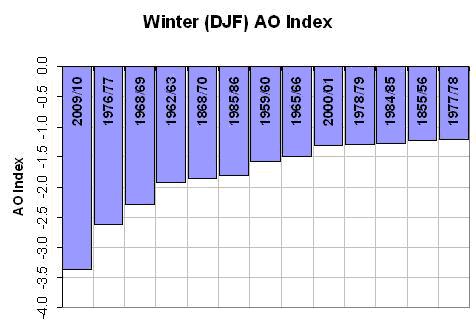
Both had a very strong high latitude blocking signal (above normal heights in polar regions). This high latitude blocking is reflected in the negative arctic oscillation state, a record since 1950 (enlarged here).

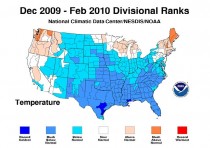
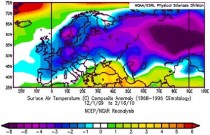
The effect on the surface has been a cold winter as discussed in the US and across Eurasia (enlarged here) and here .
So why the satellite temperature blip upwards? First of all the temperatures always spike up in El Ninos and down in La Ninas (enlarged here).
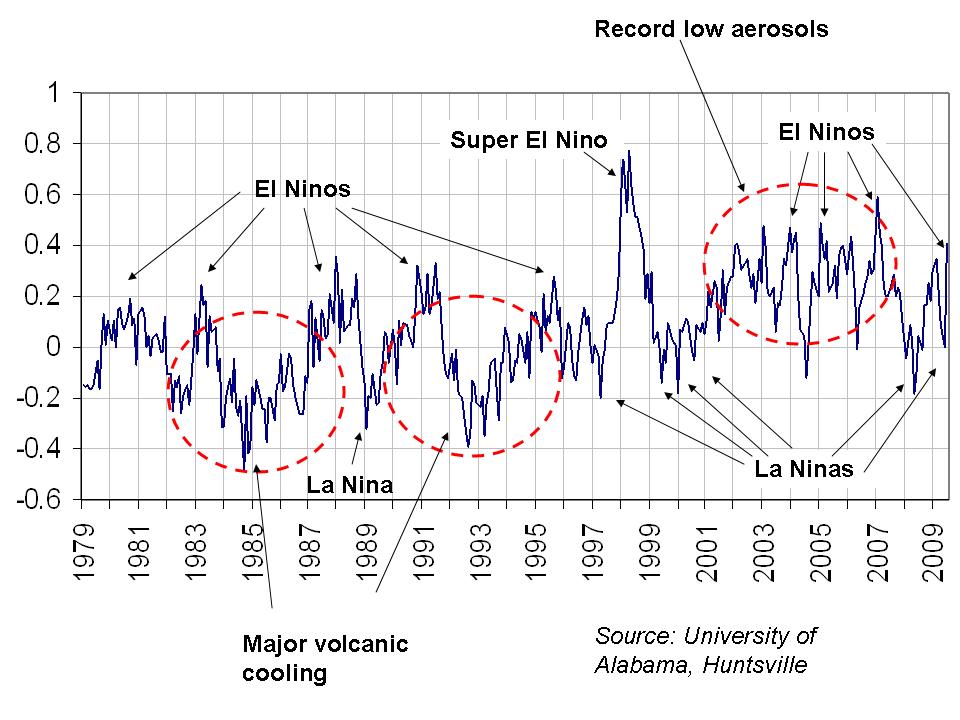
This is because El Ninos translate into warm tropics and subtropics. When the AO is strongly negative the subtropical jet stream is depressed south and the subtropical high pushed south and weakens. This results in weakened trade winds and easterlies. The high pressure causes increased subsidence which results in less cloudiness. Both of these factors lead to warmer water in both the tropics and subtropics. Since these latitude bands have the largest areas (the earth’s circumference is greatest at the equator), they contribute to the global blip. You can see the suppressed subtropical high, winds, cloudiness and elevated temperatures here (enlarged here).
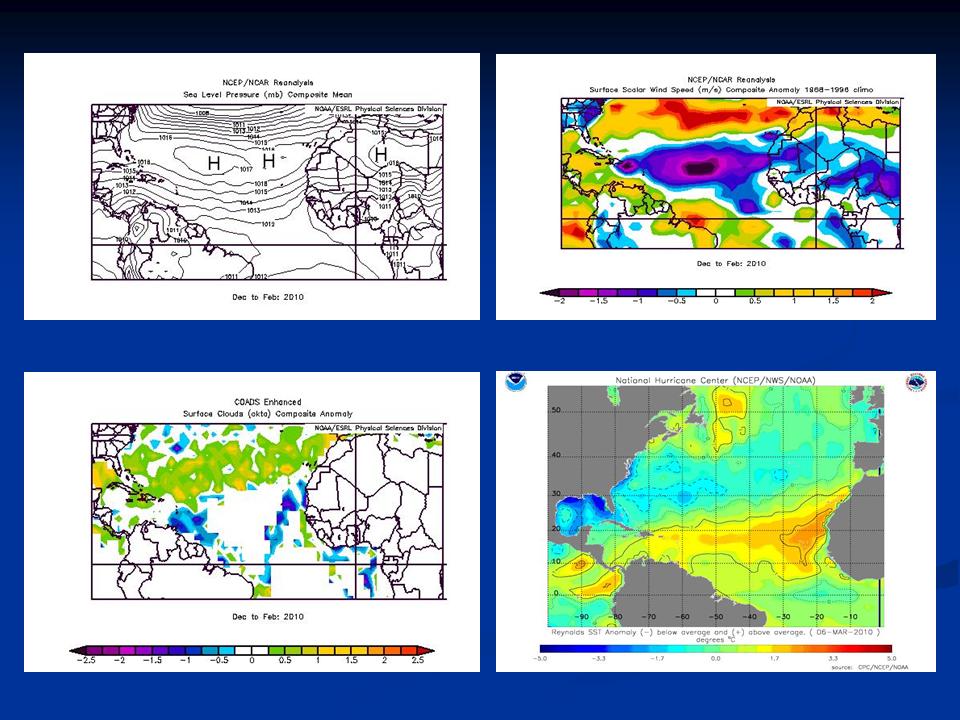
THE PDO POPS BUT WILL DECLINE
The PDO also popped slightly positive. It usually tracks with El Nino and La Nina. Here we see how it tracks with one El Nino measure, the Multivariate ENSO Index (MEI) of NOAA CDC’s Klaus Wolter (enlarged here).
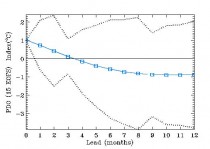
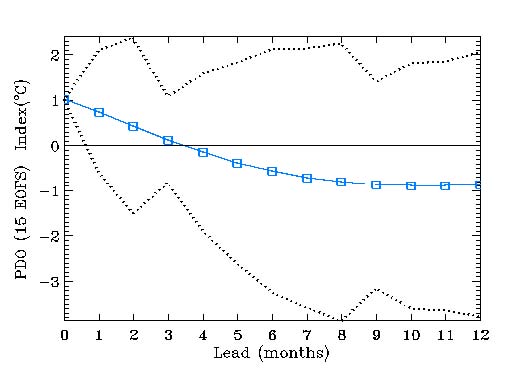
But if indeed we are in the cold PDO multidecadal mode, it should quickly decline as La Nina return quickly. NOAA’s Climate Diagnostic Center’s PDO forecast agrees (enlarged here).
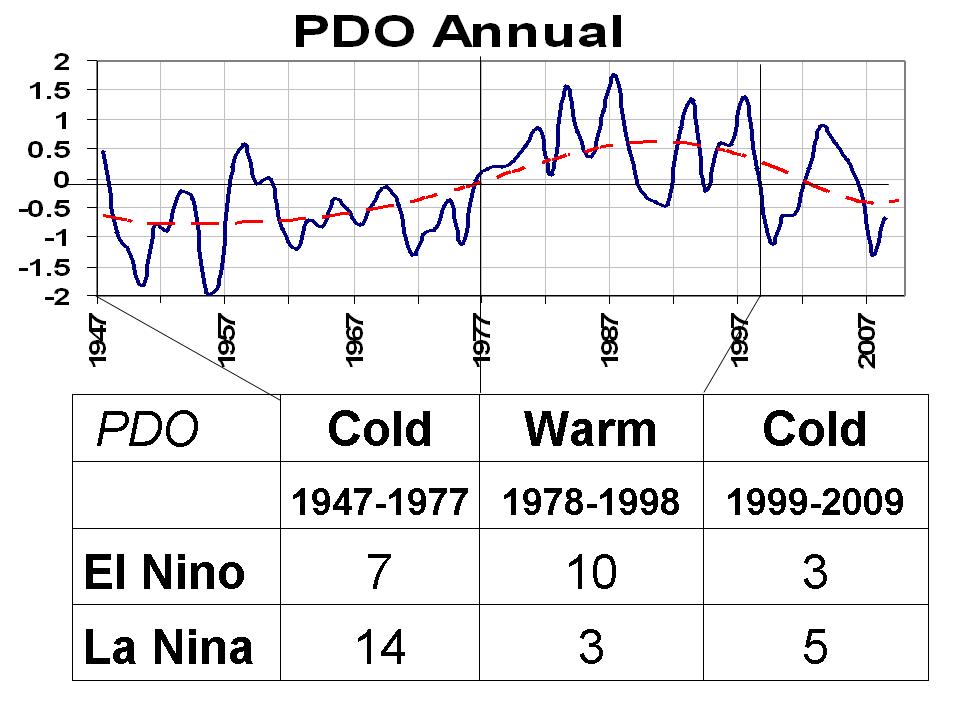
The PDO exhibits a 60 year multidecadal cycle. Notice La Ninas are more frequent, stronger and longer lasting in the cold modes and El Ninos briefer. The opposite is true for the warm mode. In both case, the ratio is 2 or 3 to 1 (enlarged here).
Since the El Ninos lead to warming and La Ninas cooling, this factor alone can explain the 60 year cycle in temperatures we have observed. The slight blip up reflects urbanization, land use changes / increasingly bad siting (enlarged here).
As discussed in a recent link, most ENSO models see a quick demise to this El Nino. Some have La Nina returning as early as this summer. This may mean a hot late summer for the central US but a return to cold across Alaska, Canada and the northern US this next winter (enlarged here).
So with a cooler La Nina and return to the negative PDO, temperatures should dip again much as they did in 2007 when we started the year with El Nino and ended with a strong La Nina. See much more here.
Adjusted Temperature Record for PennsylvaniaBy Jennifer M. Cohen, PhD.
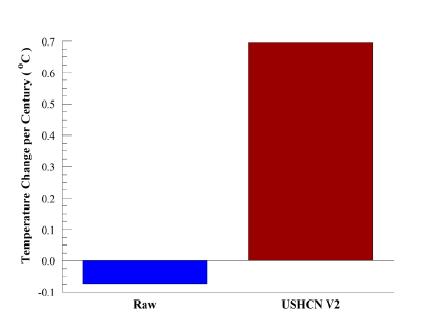
ABSTRACT
This report compares the raw with the United States Historical Climatology Network Version 2 (USHCN V2) adjusted temperature records for the twenty-four USHCN listed temperature stations in the state of Pennsylvania. Averaging over the twenty-four stations the raw data yielded a small linear decline with temperatures trending -0.1 plus or minus 0.1 C/century, while the U.S. Historical Climatology Network (USCHN) Version 2 adjusted data revealed an increase of 0.7 plus or minus 0.1 C/century. Over the twelve year period 1998-2009 a drop in temperature was observed in both data sets with a raw trend of -0.75 ± 0.1 C/decade and an adjusted trend of -0.65 plus or minus 0.1C/decade.
INTRODUCTION
The USHCN Version 2 (USHCN V2) temperature record adjustment scheme is designed to “reduce uncertainty in temperature trends for the United States”. Raw data are subjected to checks for inconsistencies, such as a daily maximum that is lower than the minimum and errors or a temperature reading that is impossibly high or low. “Time of observation” corrections are introduced which can change the overall temperature trend over time when compared to the raw record. Menne, et al estimate that this yields an increase in the maximum temperature trend of 0.15C per century and an increase in the minimum trend of 0.22C per century. Hence, we anticipate an average increase of about 0.185C per century to be added to whatever trend is found in the average temperature raw data. This is consistent with the USCHN Version 1 (USHCN V1) adjustment method.
An adjustment for updating from liquid in glass (LiG) to the current electronic thermometers results in a further rise in the temperature trend. Temperature stations were updated beginning in the early 1980s. Most were equipped with the electronic versions in the mid-80s, but 10% of the stations were updated after 1994. Approximately 0.52C is added to the raw maximum reading while 0.37C is subtracted from the minimum to account for the electronic readings. Therefore, recent average temperatures are increased by about 0.075C to account for the new equipment which is about 0.025C higher than USHCN V1. We will consider temperature records from 1895 through 2009 and compute temperature trends over a century. This adjustment is expected to add something in the neighborhood of 0.075C per century to whatever trend is seen in the raw data.
Menne, et al combine documented and undocumented changes made after the TOB adjustments in giving their changes to the temperature trends. Their estimate of raising the maximum temperature trend by 0.31C per century, while leaving the minimum temperature trend unchanged, includes the LiG to electronic switchover. These combined changes serve to elevate the average temperature trend by about 0.155C per century. Thus, roughly 0.08C per century is added to the trend due to factors other than switching from LiG to electronic measurement.
Summarizing, we anticipate an upward shift in the average temperature trend of about 0.34C per century. This includes the TOB adjustment increase of 0.185C per century, an increase of 0.075C per century during the LiG to electronic measurement switchover, and a 0.08C per century increase for other documented and undocumented changes.
An important feature of this update involves dropping the Version 1 correction for the Urban Heat Island (UHI) effect in favor of an algorithm that detects undocumented change points. This technique should spot sudden shifts such as undocumented station location and equipment changes. It is less clear how it detects the much slower change in the size of a population center.
The checks and adjustments leave the casual observer to wonder how the raw temperature trends compare with those of the final USHCN V2 product where they live. This survey addresses that question for the state of Pennsylvania.
CALCULATIONS
The temperature records are those available through the online USHCN database. Their locations within Pennsylvania are shown in Fig. 1. Nine of the twenty-four stations had records that ended prior to February of 2010. Data were converted from Fahrenheit to Celsius for this review. No changes were made in the data.
Linear least squares was employed to find the best straight line fit through the data. Our interest is not in the precise average temperature for a given year, but in the temperature trend or slope of the line. Averages of the trends were taken over the twenty-four stations. The raw and USHCN V2 adjusted temperature trends are depicted in Figure. The raw temperature records show a decrease with temperatures trending at a rate of -0.1 plus or minus 0.1 C/century and the USHCN V2 records reveal an increase of 0.7 plus or minus 0.1 C/century (below, enlarged here).

Adjustments have resulted in an increase of about 0.8 C/century. This was higher than the 0.34C per century we had initially anticipated. Since the introduction of the electronic temperature stations likely took place prior to 1995, a second round of data analysis was initiated. This should eliminate or nearly eliminate the LiG to electronic thermometer correction in the temperature trend.
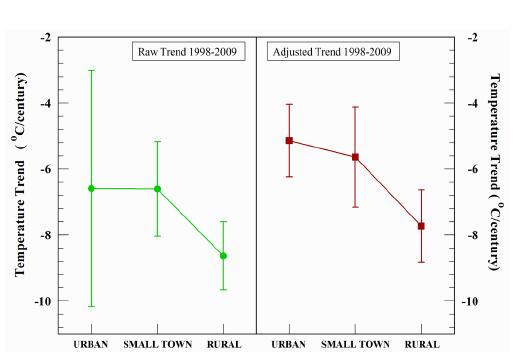
Consider the records for the years from 1998 to 2009, a period during which there may have been a temperature drop. Linear regression was used to determine the best fit linear trend. The sampling error makes it impossible to detect the LiG to electronic thermometer 0.075C uniform shift. However, in this case the temperature trend itself is of interest. During the 1998-2009 time period, a trend toward cooler temperatures was observed for stations in rural, small town, and urban locations (below, enlarged here).
CONCLUSIONS
In the state of Pennsylvania the raw temperature record reveals no significant change in temperature over the period from 1895 to 2009. The USHCN V2 adjusted temperature record shows an increase of less than a degree Celsius over those years. A cooling trend is observed in the raw and USHCN V2 records for the past 12 years. In both the short and longer term cases the USHCN V2 adjusted data yielded trends that were roughly 1C per century higher than those found in the raw temperature records. See full post with individual station plots.
By VJones, Digging in the Clay
Congressman Johnson may be concerned about the increasing population on Guam causing the island to tip over, but has population increase had interesting consequences for one of the island’s weather stations?

Andersen Airforce Base, Guam (original here)
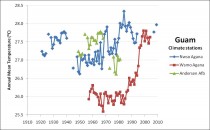
There are three stations for Guam in the GHCN data file: Andersen AFB; NWSO Agana and WSMO Agana. For such a small island three weather stations, all in similar topography on the northern part of the island, would be expected to show very good correlation, after all they are within 10 miles of each other, but one shows a very large and sudden warming during the 1990s.
These are the stations from GISS Station Data:
NWSO Agana, G 13.5N 144.8E (WMO id 91212) Rural area 1921 - 2010
WSMO Agana, G 13.6N 144.8E (WMO id 91217) Rural area 1956 - 2004
Andersen AFB, 13.6N 144.9E (WMO id 91218) Rural area 1949 - 1981
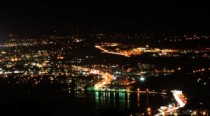
As these are all classified as rural stations, they are not adjusted. NWSO Agana is located at the busy international airport, seen in the picture above just inland from the capital, Hagatna, at night. Andersen Airforce Base is in the northeast of the island, but WSMO Agana was hard to find initially due to the very approximate latitudes and longitudes in the GISS station data.
Here is what the three temperature records look like when plotted together (below, enlarged here):
For Andersen AFB and NWSO Agana there are variations of just over a degree, and there is obviously a discrepancy between them in how the local topography responds to climate. Also, these are airports so there may be human influences there. However, that is one hell of a rise in WSMO Agana. How can you get that much warming at one of three such close stations in such a short period? Did no-one notice? I thought a lot of the checking that is done of the climate record is supposed to pick up and throw out “outliers”? OK, perhaps that is just the odd month or the odd year. This has intrigued me for a while. That cannot be normal and it certainly isn’t caused by CO2. Time to do some digging…
VJones looks at the 3 stations in some detail in the post. She continues:
NCDC site - the end date for WSMO Agana: 2nd April 1998. NCDC concurs. Quick - scroll back up to that graph again. Yup - data for WSMO Agana up to 2004. How can this be? FILLED in DATA?
Now the WWRC also had data for these three stations, although it said “last updated 2006”. There was a good fit with what I had pulled off the GISS site (at the end of November) - the data originating in the NCDC GHCN data file. I just plotted what I found and there are minor discrepancies granted, but it is the gaps I was interested in (image here).
In the Western Region Climate Center (WRCC) data, Andersen AFB continues reporting until 2002, with rising temperatures; WMSO Agana stops reporting in 1997 (as it should); there is no gap for NWSO Agana, but that fits reasonably closely with the post-1997 WMSO Agana data. So in the GHCN/GISS data NWSO Agana stops reporting for a while, but the data seems to be spliced into another station. Interesting. So what? Well the implications only become clear when you realise what this does to the temperature anomalies. The following graph (enlarged here) shows the effect:
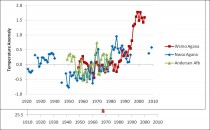
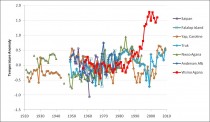
Look at that hockey stick - wow! This gives a sustained 1.5 degree anomaly for Guam for nearly a decade. See in the post here how it affects numerous grid boxes used to compute global anomalies. See here also how it stands out as an outlier with respect to other stations in the region. Note that Koror (Palau) and Truk (Chuuk) are over a 1000km from Guam. WSMO Agana still sticks up like a sore thumb.
By Lissette Gonzalez, CBS4
Unless you spent this winter somewhere else, you know it was chilly, at least by South Florida standards. Now, with the data in, the National Weather Service has made it official. The first 3 months of the year were the coldest ever reported in Miami Beach, Naples, and West Palm Beach, and was among the coldest winters ever for Ft. Lauderdale and Miami.
That information was included in an analysis of winter weather patterns conducted by the National Weather Service weather forecast office in Miami.
Forecasters said March set record cold readings for Miami Beach, which was 5.8 degrees colder than normal, on average, and for Naples, where the average temperature was almost a degree colder than the previous record.
Forecasters say, overall, there were only a handful of days where temperatures were above normal in South Florida.
Miami temperatures averaged almost 5 degrees below normal, making the January-March period the 9th coldest ever, while Ft. Lauderdale had it’s 4th coldest period ever.
While the cold weather of winter appears to be over, that doesn’t mean South Florida won’t continue to see cooler-than-normal temperatures, according to the National Weather Service.
Their outlook claims cooler than normal coastal water temperatures in Florida will combine with the continued “El Nino” weather pattern to likely keep April temperatures below the norm.
The May forecast sees temperatures closer to normal, but that comes with the likelihood rainfall will be greater than normal. All of South Florida also saw an increase in rainfall when compared to previous years, but West Palm Beach, with almost 11 inches of rainfall in March, saw it’s 5th wettest march ever. Miami Beach, with just over 4 inches of rain in March, saw it’s 9th wettest March ever. See story here.
---------------------
Longest Below 80F Streak in many Southern Locations
NWS
High temperature of 80 degrees today ends record-breaking streak of below 80 days at 105 at the Jacksonville international airport. It still remains the coldest start to a calendar year in Jacksonville climate history. Today, the maximum temperature at Jacksonville International Airport reached 80 degrees. The last time the temperature reached 80 degrees was on December 15th, 2009. This streak is ranked first for the longest stretch of days without reaching 80 degrees since records began at the airport in 1948.
In addition...across southeast Georgia...Saint Simons Island and Alma have both set new records for consecutive days below 80 degrees. In fact it has been 5 months since either site has reached 80 degrees...last year on October 31st, 2009. Including today...the 151 consecutive day streak below 80 degrees breaks the old record of 146 days set at Alma in the winter of 1969-70...and ties the old record of 151 days at Saint Simons Island set in the winter of 1968-69.
Record of consecutive days of daily high temperatures below 80 degrees has ended in Shreveport, Louisiana on Wednesday, March 31st. As part of the very cold late fall and winter experienced across the four state region, high temperatures have failed to reach 80 degrees in Shreveport, LA since last doing so on October 15th, 2009, where the high temperature reached 84 degrees. This resulted in a record 166 consecutive day streak being set Tuesday, March 30th, 2010, surpassing the old record of 165 days ending on March 27th, 1924. Nearby Texarkana, AR (records since 1892) has a record of 174 days below 80F, through 3/31/2010 (new record: began 10/9/2009 still ongoing.) El Dorado set a record of 172 days beating out the 166 days in 1987.
By Henk Tennekes
Engineers cave in to green pressure, thanks to politically driven funding.
Wind energy is an engineer’s nightmare. To begin with, the energy density of flowing air is miserably low. Therefore, you need a massive contraption to catch one megawatt at best, and a thousand of these to equal a single gas- or coal-fired power plant.
If you design them for a wind speed of 34 miles per hour, they are useless at wind speeds below 22 mph and extremely dangerous at 44 mph, unless feathered in time. Remember, power is proportional to the cube of the wind speed. Old-fashioned Dutch windmills needed a two-man crew on 12-hour watch, seven days a week, because a runaway windmill first burnt its bearings, then its hardwood gears, then the entire superstructure.
This was the nightmare of millers everywhere in the “good” old days. And what did these beautiful antiques deliver? Fifteen horsepower at best, in favourable winds, about what a power lawn mower does these days. No wonder the Dutch switched to steam-powered pumping stations as soon as they could, in the late 19th century.
Since the power generated by modern wind turbines is so unpredictable, conventional power plants have to serve as back-ups. These run at less than half power most of the time. That is terribly uneconomical - only at full power do they have good thermal efficiency and minimal CO2 emissions per kWh delivered.
Think also a moment of the cable networks needed: not only a fine-maze distribution network at the consumer end, but also one at the generator end. And what about servicing? How do you get a repair crew to a lonely hillside? Especially when you decided to put the wind park at sea? Use helicopters - now that is green!
For that matter, would you care to imagine what happens to rotor blades in freezing rain? Or how the efficiency of laminar-flow rotor blades decreases as bugs and dust accumulate on their leading edges?
Or what did happen in Germany more than once? German legislation gives wind power absolute priority, so all other forms of generating electricity have to back off when the wind starts blowing. This creates dangerous, almost uncontrollable instabilities in the high-voltage network. At those moments, power plant operators all over Europe sweat blood, almost literally. The synchronization of the system is also a scary job: alternating currents at 100,000 volts or more cannot be out of phase more than one degree or so, else circuit breakers pop everywhere and a brownout all over Europe starts.
One application might be attractive, though. Suppose you fill a water basin in the hills nearby using wind power when it blows, and turn the water turbines on when emergency power is needed for one reason or another (a power plant failure, a cold winter night).
Wind power is a green mirage of the worst kind. It looks green to simple souls but it is a technical nightmare. Nowhere I have been, be it Holland, Denmark, Germany, France or California, have I seen wind parks where all turbines were operating properly. Typically, 20% stand idle, out of commission, broken down. Use Google Videos to find examples of wind turbine crashes, start meditating and reach your own conclusions.
Why don’t politicians listen to engineers? Why do engineers cave in to politically inspired financing? Merely to join the green daydreaming? I am an engineer; I want to be proud of my profession.
Henk Tennekes is an aeronautical engineer and the former research director of KNMI, the Dutch National Weather Service. This article was published today by The Pielke Research Group here.